Pszów, Poland · Town planning
Pszów: 164 residents map their bus station and market square
Before drawing a single line, a team of town planners asked the people who use the place every day. Here is how a microplanning survey in a town of 13,000 worked.
 Towarzystwo Urbanistów Polskich (Society of Polish Town Planners), Silesian Branchas part of the microplanning project
Case study · October 2026
Towarzystwo Urbanistów Polskich (Society of Polish Town Planners), Silesian Branchas part of the microplanning project
Case study · October 2026
The place
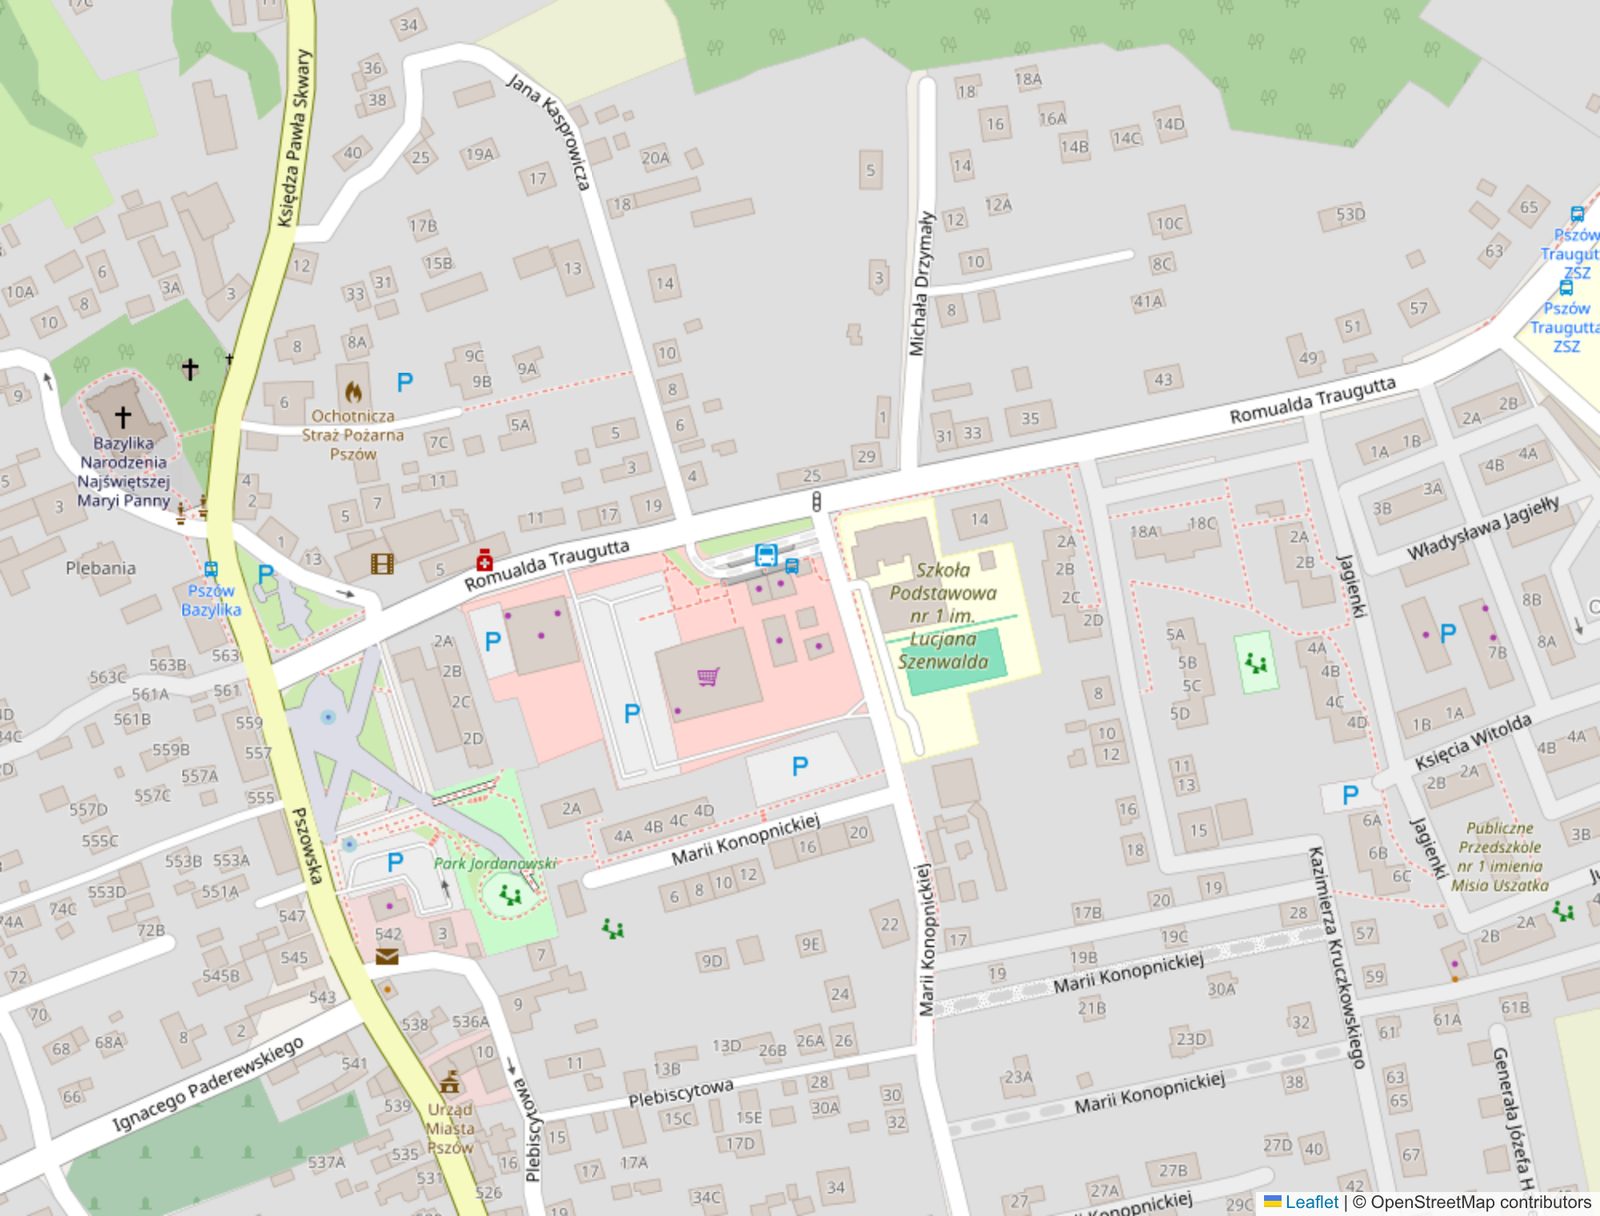
Pszów is a town of about 13,000 people in the Rybnik coal district of Silesia. The area around its bus station and market square is where residents shop, catch the bus and cut across on foot. The town is now planning to change it.
In summer 2026 the Silesian Branch of the Society of Polish Town Planners (Towarzystwo Urbanistów Polskich) took this area as its microplanning project. The rule was simple: ask residents first, design later.
The goal
The city is considering changes to the area around the bus station and market square. The goal of the microplanning project was to learn, before starting any design work, how residents currently use this place: where they wait, where they actually walk, which places they avoid, and what they wouldn't want to lose. The collected responses were meant to set the direction for further design and subsequent workshops with residents.
The survey worked at three distances, each marked on the map in its own colour. The station and the market square themselves, the area whose future is being decided. The streets about 50 metres around them, to see how the station's noise and lack of greenery reach the neighbours. And the wider area about 100 metres out, to see how the place connects with the rest of Pszów and how people get there.
The survey
The questions came out of a brainstorming session of the whole team. Anna M. Pyziak, Secretary General of TUP, selected and prepared the final set of questions and map tasks, keeping the survey short enough not to put residents off, and onboarded two students, Julia Stachura and Patryk Stachurka, into Mapsurvey. They transferred the map and the questions, ran the survey, analysed the data and presented the results.
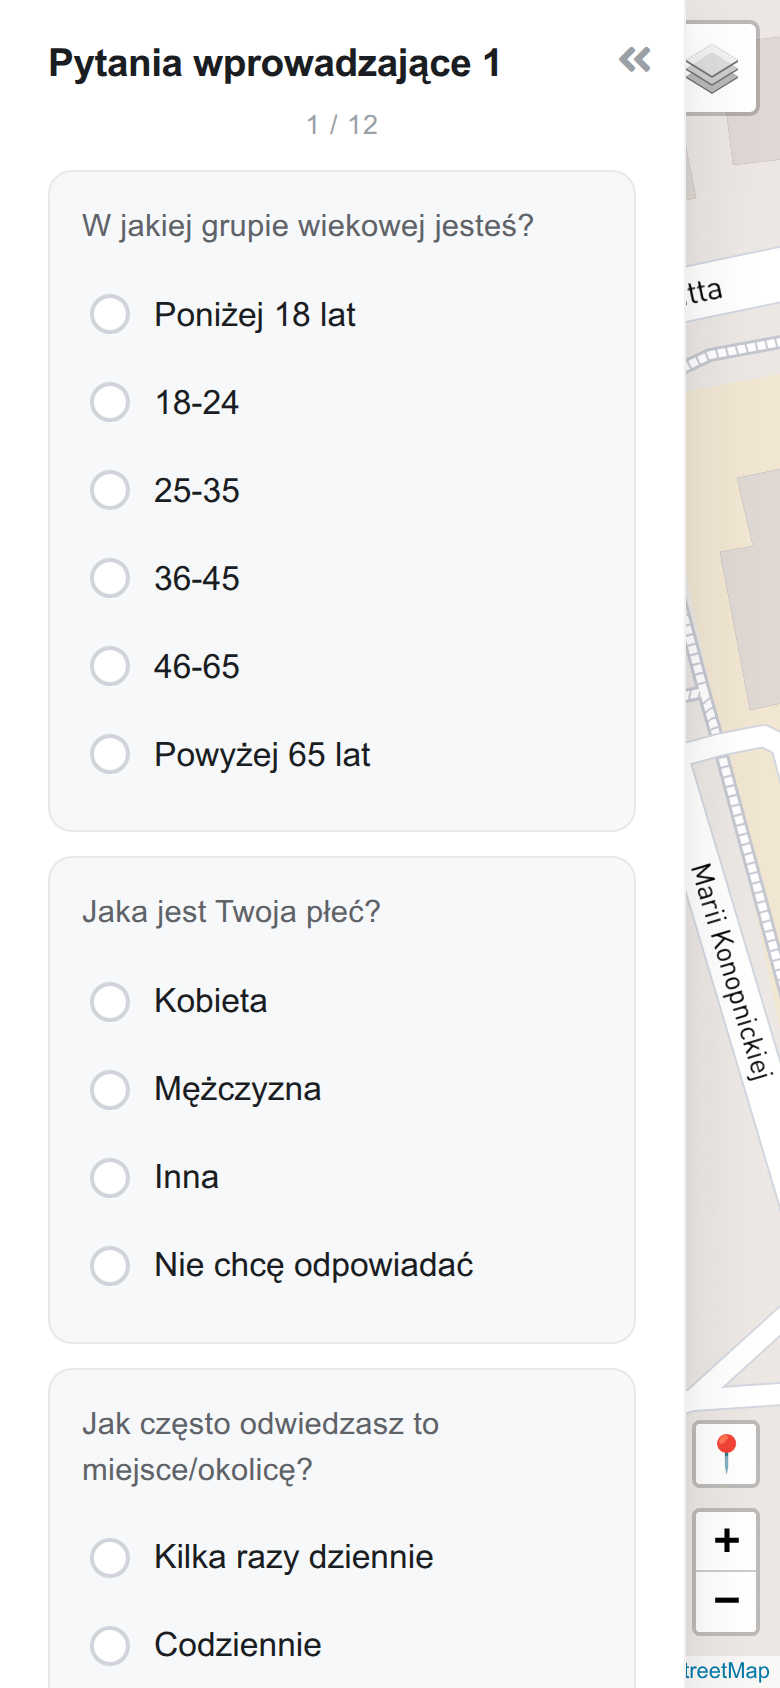
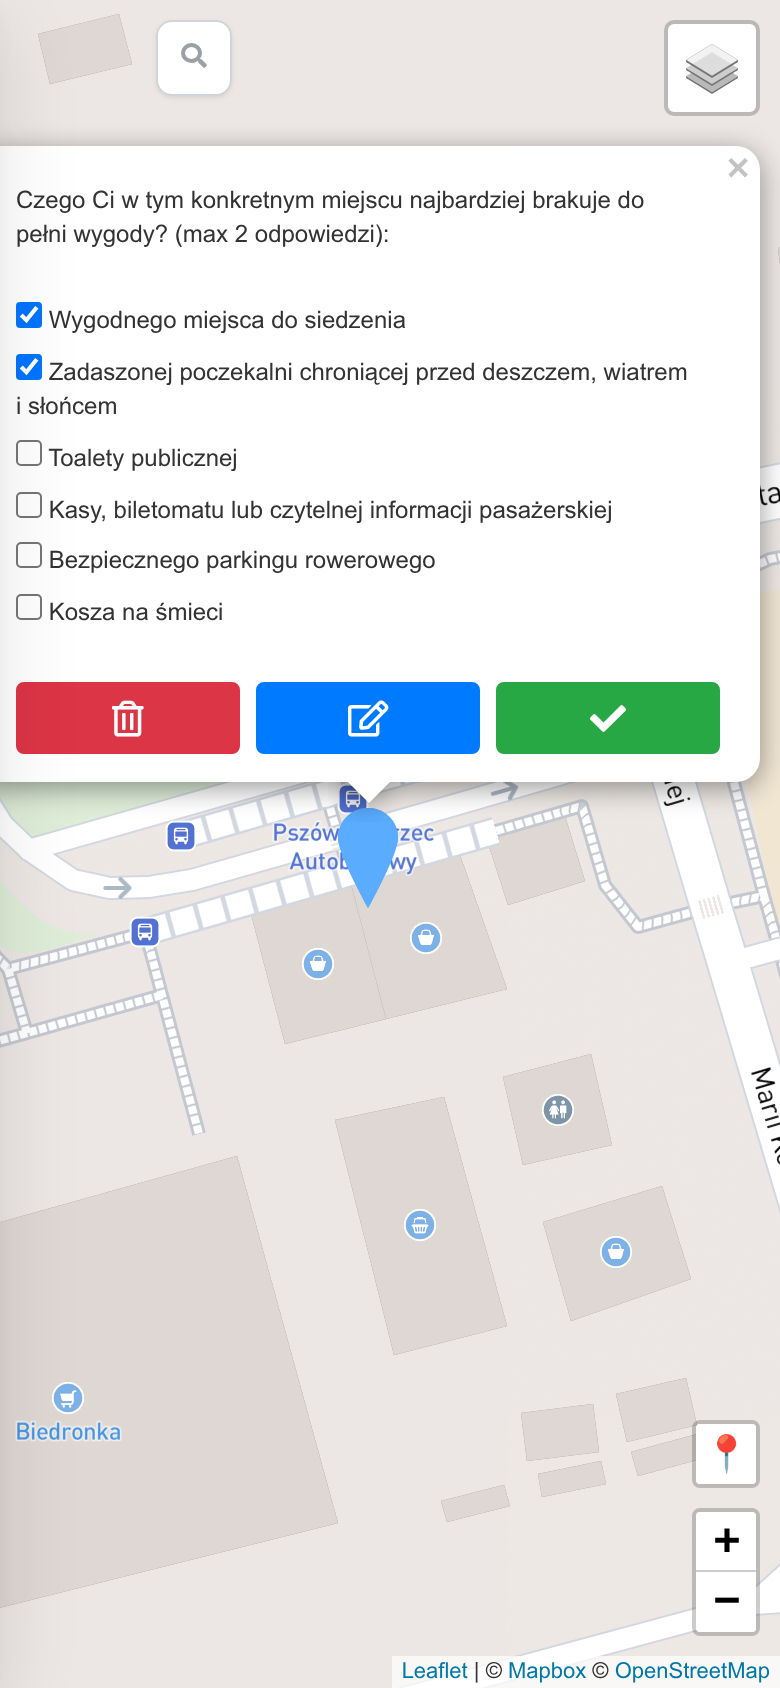
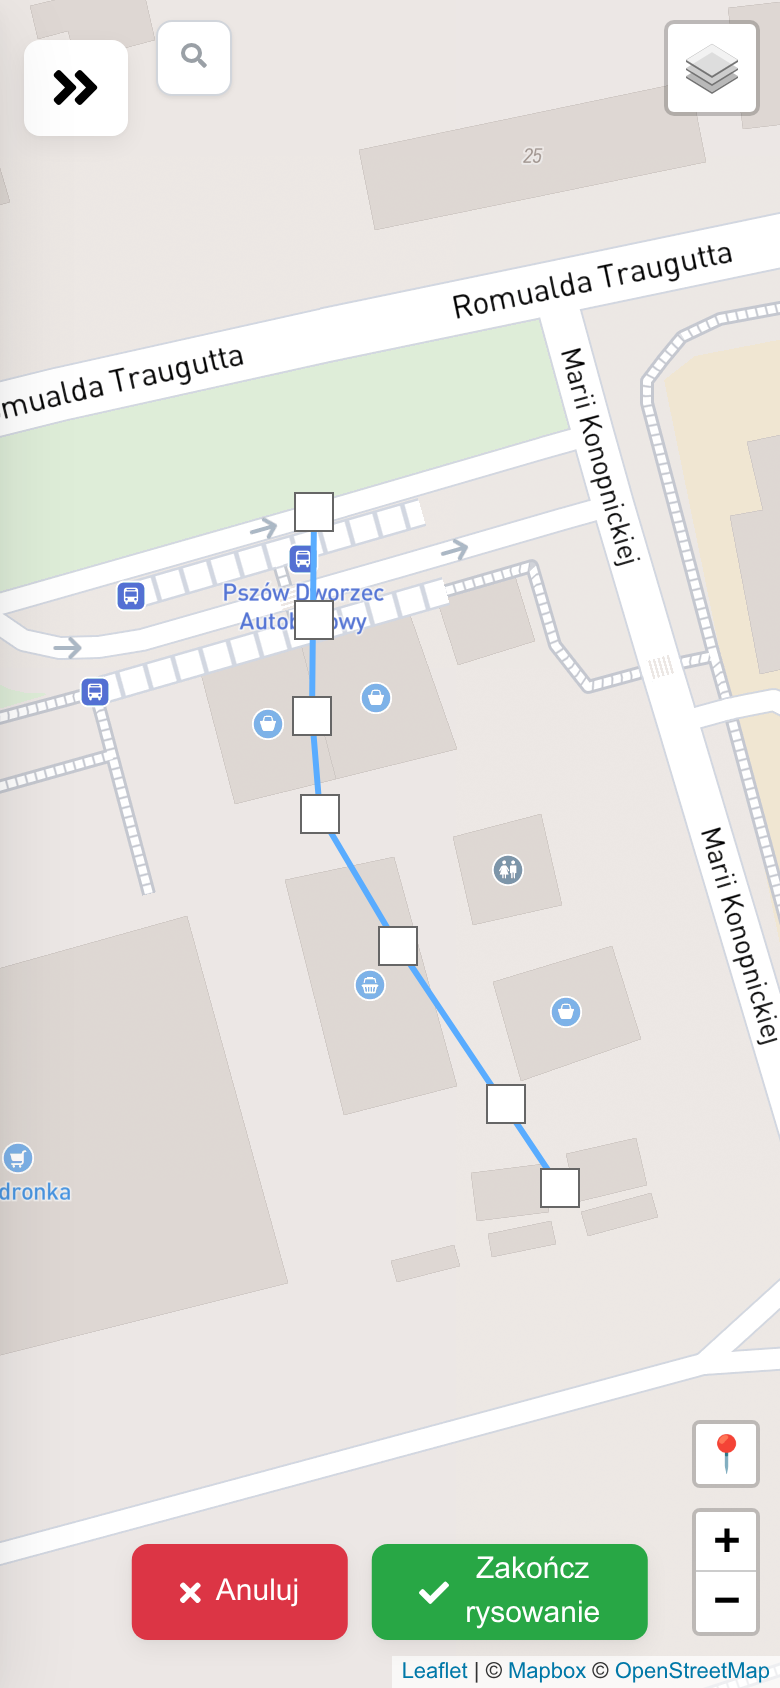
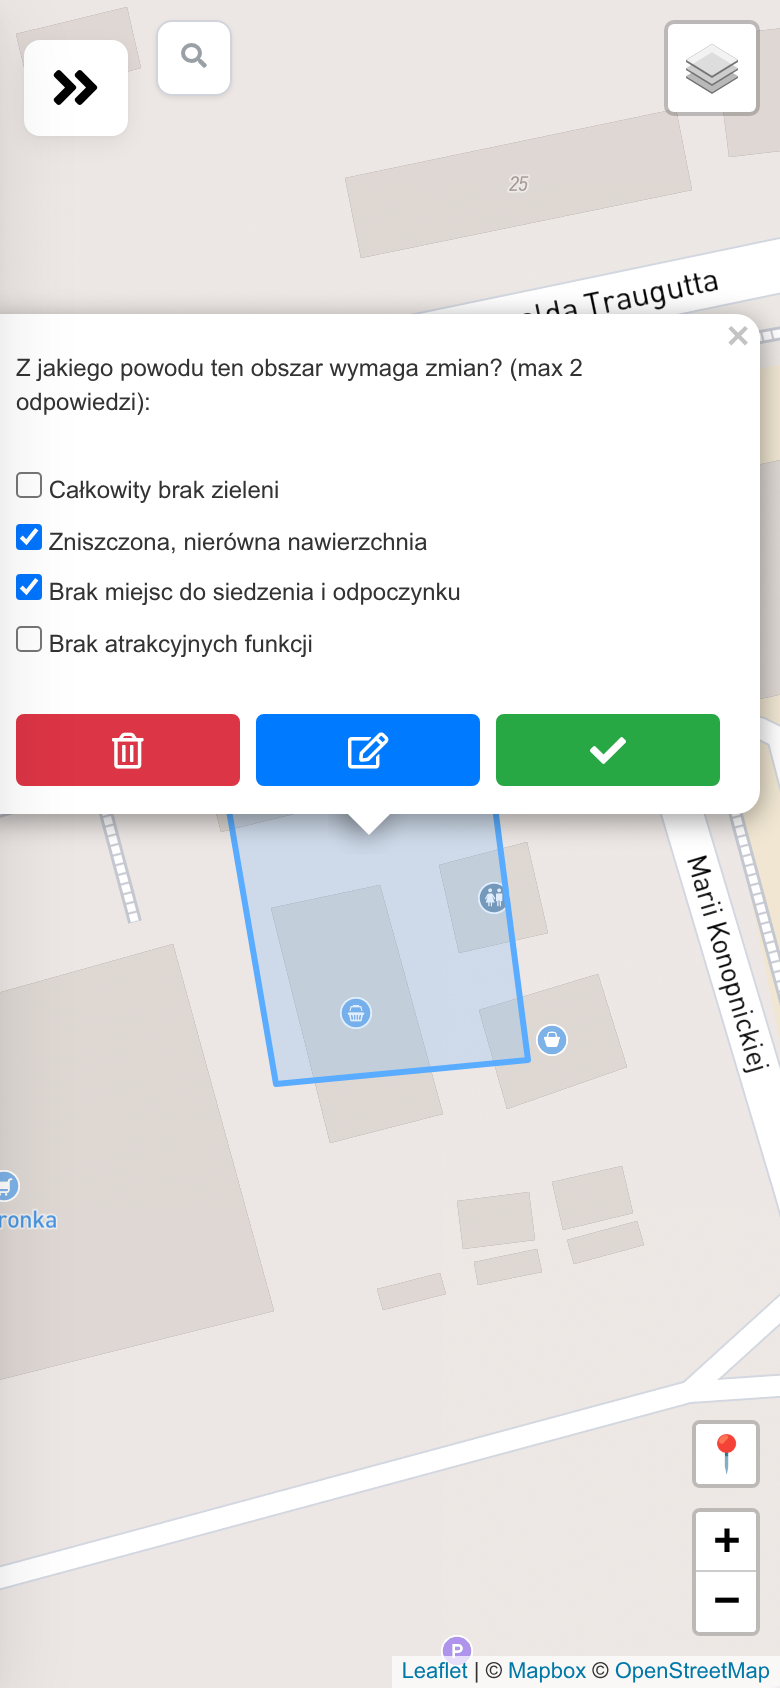
Most of the survey was on the map. Residents marked where they usually wait, drew the shortcuts they actually walk, outlined the area that needs the biggest change and the one they avoid, chose where to plant a large shade tree and what must be kept, and drew the stretch of pavement that is hardest to walk. A few short questions around the map asked about age, how often people come and how safe they feel.
What came back
The town hall invited residents on its website on 7 August. About 100 answered on the first day, most of them on their own phones. By the end of the month 164 residents had answered and 83 of them had drawn on the map, 556 marks in total. Those who went through to the end needed about 7 minutes.
What residents told the planners
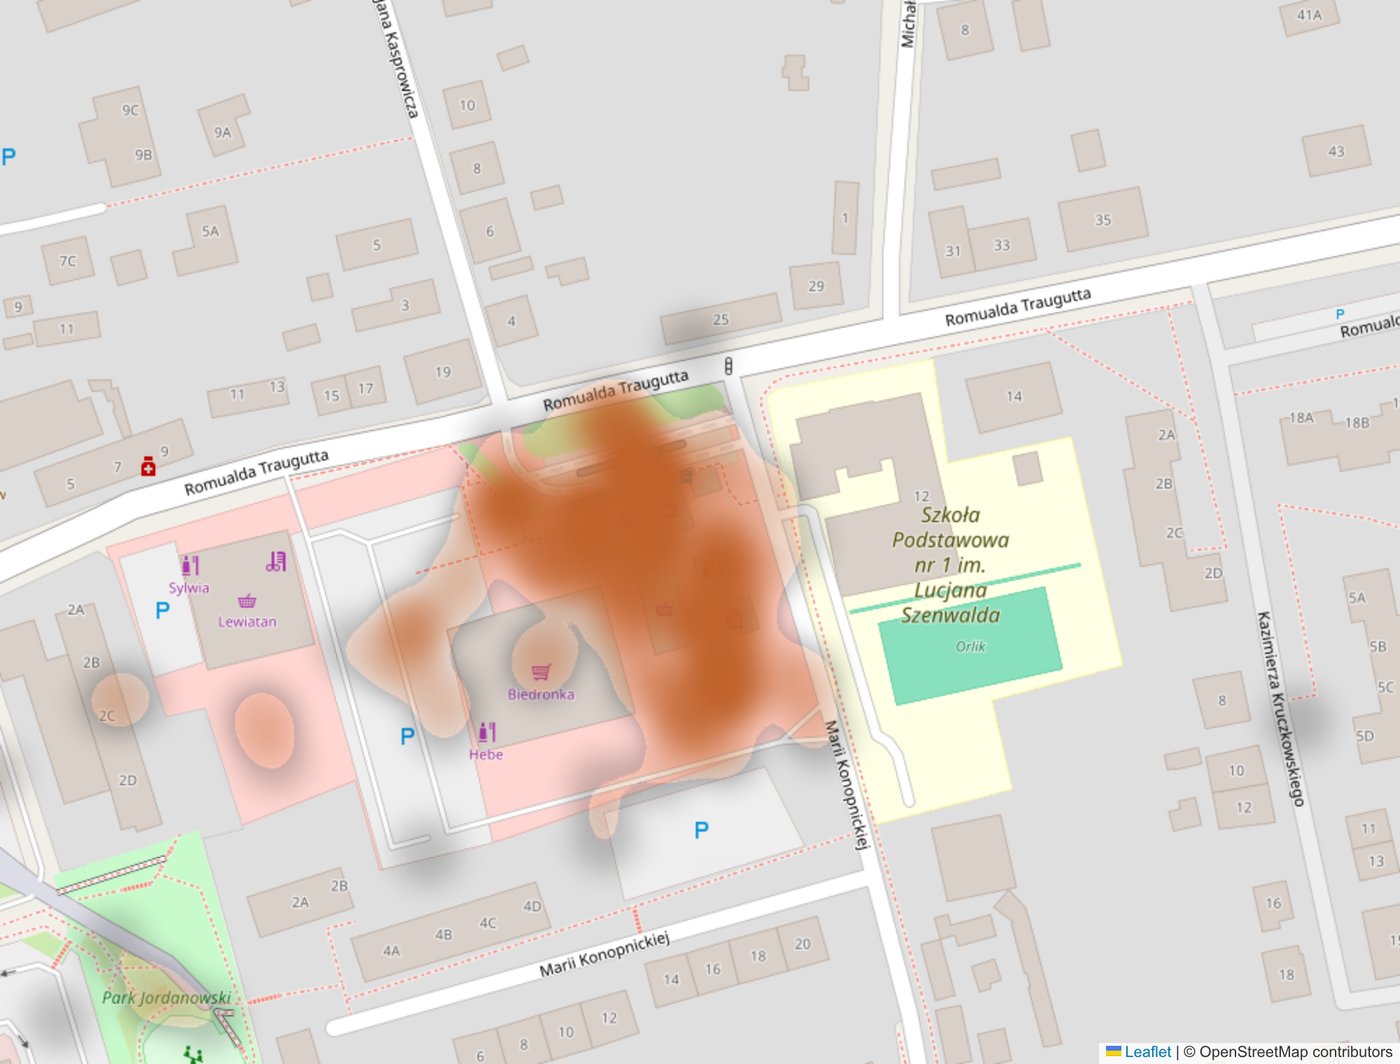
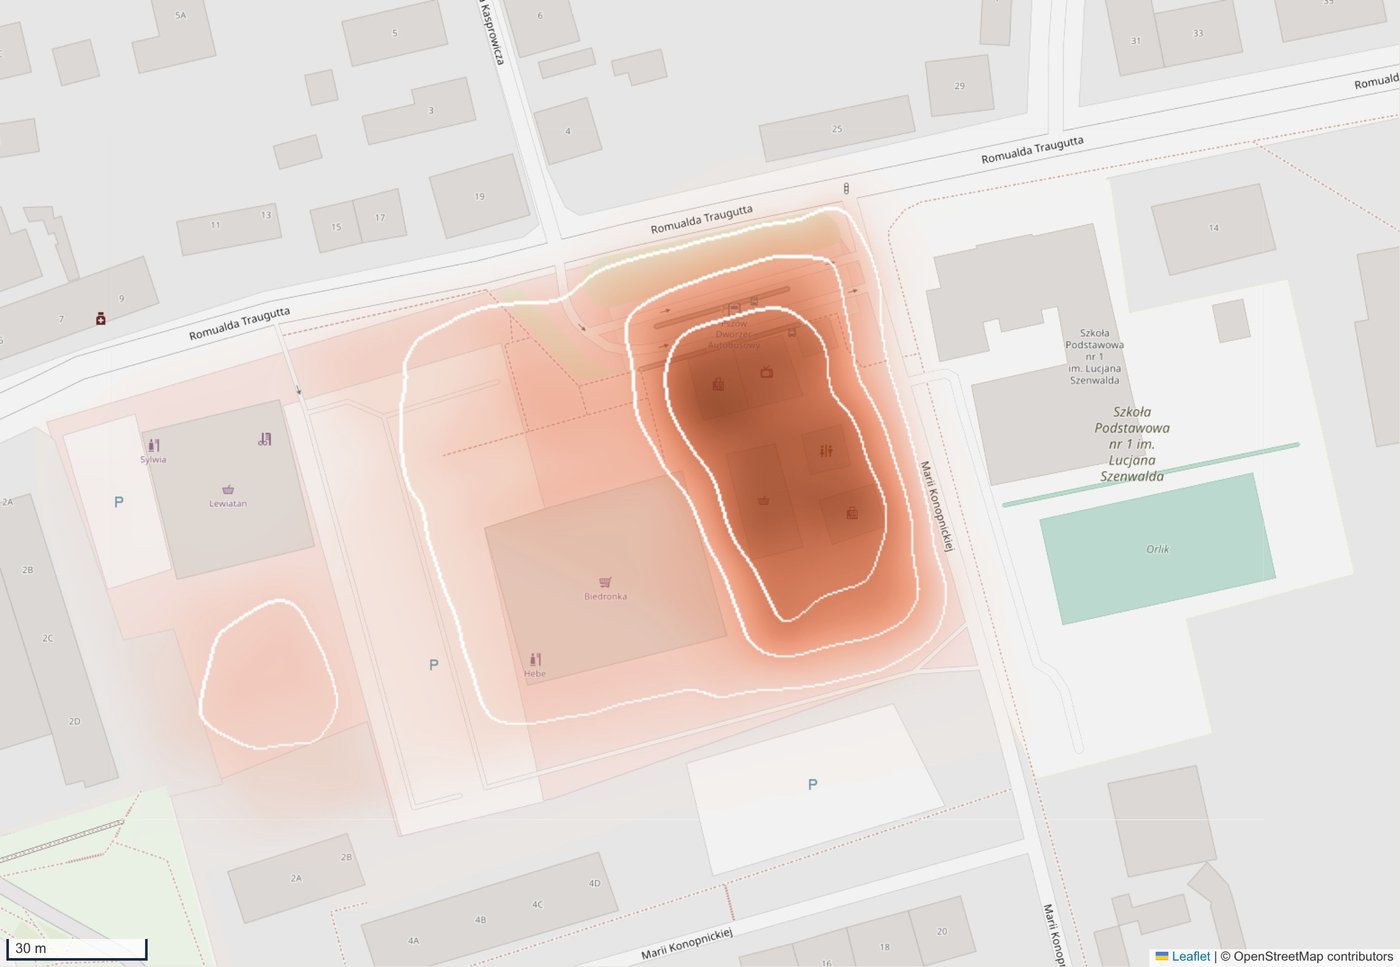
The marks pile up in one place. Of the 52 residents who marked where they wait, 26 chose the same spot: the platform by the narrow passage between the station kiosks. It is also the spot marked as run-down most often (27 people), and the core of the area residents want changed most: at its centre, 22 people's outlines overlap.
What people want there is concrete. Of those who described their waiting spot, 33 of 53 asked for a roofed shelter and 28 for a place to sit. Two in three rated their sense of safety as average or worse, and the fixes they asked for most were cameras and better lighting.
Change does not mean clearing everything. The area around the platforms and the market square are also at the top of the list of things to keep, so what residents value sits inside what they want changed. And when asked where they would plant one big shade tree, 22 residents picked the same lawn, on the west side of the station.
What happens next
The answers feed the next stage: participatory workshops in Pszów running from September to November 2026, where residents and planners work on the design together.
Collecting quantitative data through a digital map at such an early stage allowed us to thoroughly prepare for qualitative workshop techniques, giving a voice to the people who use the bus station and market square every day and providing a solid foundation for further microplanning.
Anna M. Pyziak, Secretary General, Towarzystwo Urbanistów Polskich
Project: Towarzystwo Urbanistów Polskich (Society of Polish Town Planners), Silesian Branch as part of the microplanning project.
The survey creation began with a joint brainstorming session with the entire team, where everyone contributed ideas. Based on these, Anna M. Pyziak selected and prepared the final set of questions and map tasks ensuring the survey remained engaging and concise enough not to discourage residents from completing it. She also provided methodological guidance and onboarded students Julia Stachura and Patryk Stachurka into the Mapsurvey platform, who then transferred the map and questions, managed the ongoing survey administration, analyzed the data, and presented the results.
Planning a count, a consultation or a survey like this one?
Draw your zones, write your questions and share one link. Free to start.
Create your map survey