Budget questions — split a budget, fund projects, place priced items on the map
A new question type, Budget: respondents share a fixed budget between your
priorities, or tick projects until the money runs out. And a budget on a question
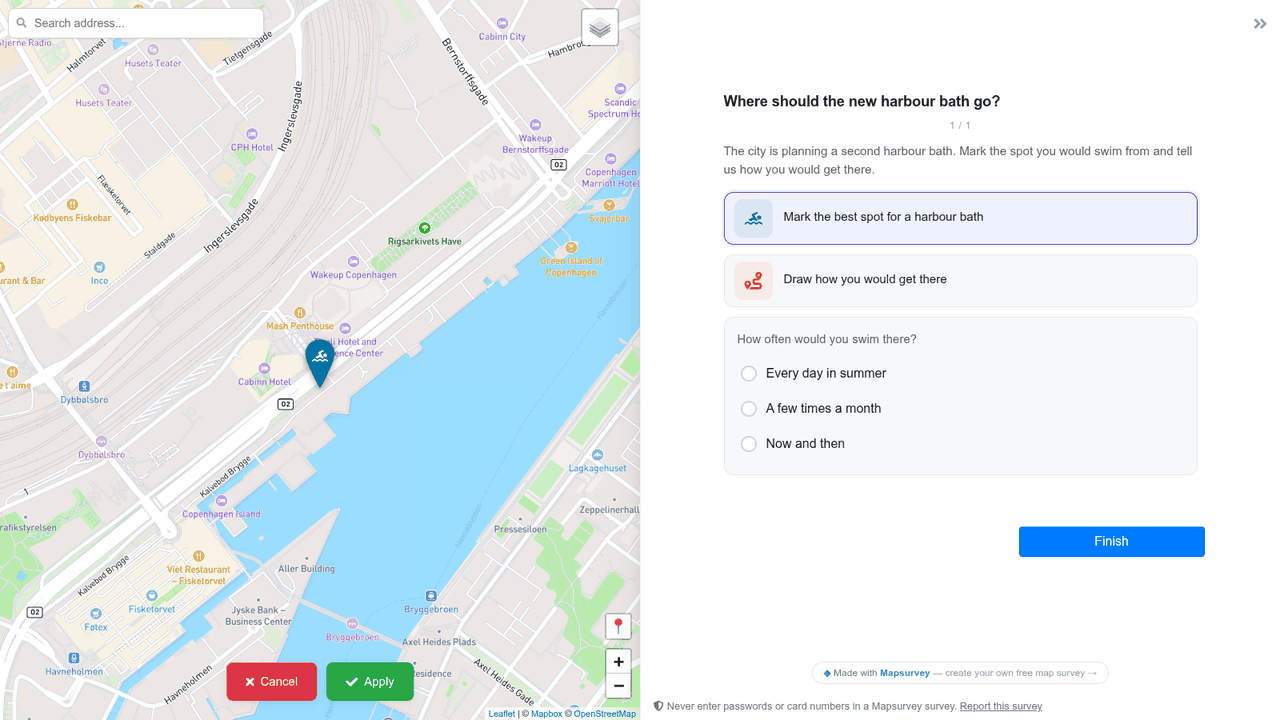
group: give the map questions inside it a price — a bench £2k each, a path £50 a metre, a
flower bed £30 a square metre — and respondents place marks until the group's total is spent. A
bar shows what is left; Next waits until the rule you set is met.
Why. Budget and precept consultations were being built from ranking
questions, which say what matters but not what people would give up. Responses, exports and
public results now show the average share per item, the projects that fit the budget together,
and where the placed items went.
Sites: one public link for a whole engagement
Sites is a new item in the sidebar. Build a public site for a project from blocks — text, FAQ, a timeline of the phases, pictures, video, documents to download, a map of the project area — and add cards for your surveys: each card follows its survey from "coming soon" to "open" to "closed, see the results". Show what residents said with charts and maps from the results, and announce an open house with registration and a calendar invitation. One survey can appear on any number of sites.
Why. An engagement is longer than one survey: a pilot, the main round, feedback on the proposal, events. Flyers and QR codes need one address that stays the same from the first pilot to the final plan, and until now that page had to be built by hand on another site. Sites are part of Pro; a published site stays online even if the plan ends.
Map styles: your own base maps, online and on paper
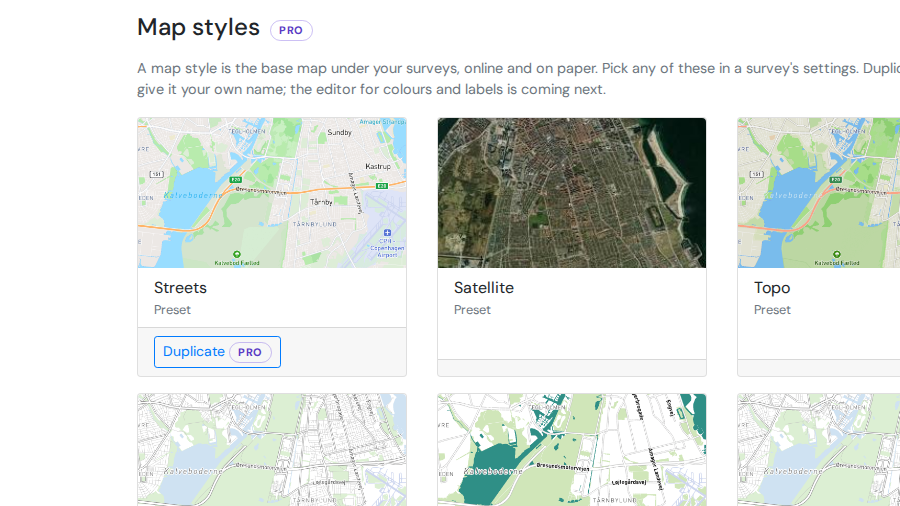
Map styles is a new page in the sidebar, under Library. It holds the five base maps — Streets, Satellite, Topo and two made for printing, Paper A and Paper B — and the ones you make: duplicate a preset, open the editor, change what stays on the map, the colours of land, parks and water, the look of streets and labels, and see the result at once, online and as the printed form will render it. Pick any style in a survey's settings; export it as a file and import it into another workspace.
Why. Planners and consultancies want the survey map to match their own cartography and to stay the same across every survey, and a paper form needs a map that survives a photocopy. Until now that meant asking us for a custom base map. Creating and editing styles is part of Pro; using any style that exists never is, so a survey keeps its map whatever the plan.
Clusters for point answers
Points that sit close together can now merge into one circle with a count. The circle splits into
smaller groups and single points as you zoom in or click it. It is easier to read than plain markers
when answers are spread far apart, for example research sites around the world.
On Responses → Map, open a point layer's ⋮ menu and choose
Create Clusters. The clusters follow your filter, and removing them brings the
points back. On a public results page, set a map block's Visualization to
Clusters.
Invited colleagues now land in your workspace
Someone you invite from Workspace → Members now arrives where you invited them.
A colleague who creates an account from the invitation link joins your workspace straight away,
with no extra workspace of their own, and sees your dashboard with a note that they have joined.
Someone who confirms an invited address later lands there too, instead of on a page asking them to
start a survey.
An editor who does not yet see any surveys reads why: surveys they create, and the ones you add
them to, appear on their dashboard.
Open and close a survey on the dates you set
Settings → Survey period takes an opening time, a closing time, or both.
Before the start respondents see a page saying when the survey opens; at the end it closes by
itself, within five minutes, exactly as if you had pressed Close — and the status chip shows
what comes next.
Reopening a survey by hand clears a closing time that has passed, so it stays open until you
set a new one. The same fields are available over the REST API and the MCP server.
Lay out each page your way — picture, side, width, a quiet column
Each section now has a Layout block. Put a picture where the map would be
(a welcome page with a photo of the place), move the questions to the right, make them a third or
half of the screen, and set them as a calm column in the middle of the panel.
On a map page you can keep the questions open while respondents place a point or draw: the
crosshair and the drawing buttons aim at the map beside them, so nobody loses the question they are
answering.
Every setting is optional and applies on computer screens; phones keep the familiar layout, and
existing surveys look exactly as before.
Translate a whole survey in one table
Every survey now has a Translations tab, between Survey and Responses. It lists
every text of the survey once — page titles, questions, help texts, answer options, the Next button,
the thank-you page — in the order respondents see it, with the original on the left and the
translation on the right. "Other" and "(Select all that apply)" appear once and one translation
fills every place they are used; a row can be translated separately when the same words need
different wording in context. Each row links back to its question in the editor.
Rows show what is missing and what is outdated — a translation
whose original was edited after it was written — and the publish warning counts both. Export the
table as a CSV for a translator, import it back, and the report says what was filled, skipped or
not found. Languages are added right there, and a second language of the survey can serve as the
source column for a translator who does not read the primary one.
The translation fields in the question, section and group dialogs now show the stored text and
open its row on the new tab, so there is one place where translations are written.
Start a survey from Claude, ChatGPT or your own assistant
The third card on New survey is live: Use your AI assistant. Pick
yours — Claude, ChatGPT, Gemini, Le Chat, Perplexity, Cursor, VS Code, Claude Code and more — and
follow the shortest way it allows. For Claude it is one button: the connector form opens filled
in, you press Add, Connect and Allow. The page notices by itself when you are connected.
Then write what you want to find out, open the prompt in your assistant, and the draft appears
on your dashboard. If your assistant cannot connect to outside tools yet, the page says so and
offers the Survey wizard instead. Building surveys through an assistant is part of Pro.
Build surveys and read responses from your own AI agent
Mapsurvey now has an MCP server. Connect Claude, ChatGPT, Claude Code, Cursor
or any agent that speaks the Model Context Protocol, and ask it in plain words: "create a survey in
German and English about where benches are missing, with a point question and an urgency rating".
It hands you the link, a QR code for a poster and campaign links to send it out. Once answers come in, ask it to summarise them, read the comments, map what people drew, or give
you an Excel file. It sees only your surveys, works through the same rules as the editor, and asks
you before it publishes or deletes anything.
How to connect. Every assistant signs you in — no token to copy; scripts can use
a personal token made for the MCP server. New survey → Use your AI assistant has the steps
for each one, and the help centre has the set-up guide and every tool. The MCP server is a Pro
feature: tools on a survey need its workspace on Pro.
The REST API
Your personal access tokens now open the whole REST API: create a survey, add
sections and questions, publish it, and read or export its responses from a script, a reporting
pipeline, a QGIS workflow or your own app. It follows the same rules as the editor — wording on a
live survey changes in place, structure goes through unpublished changes, and a token never does
more than you could in the browser.
Where to start. The help centre has a step-by-step guide and a reference of
every endpoint; the machine-readable contract is /api/v1/openapi.json. The API is a
Pro feature: calls on a survey need its workspace on Pro.
Personal access tokens
Your account now has an API & connections page. Create a personal access
token there — with the permissions you choose, for one workspace or all, with or without an
expiry — and use it from a script, a GIS tool or an AI agent with
Authorization: Bearer …. Revoke it with one click.
What it opens. The first endpoint, /api/v1/me, is live today; the
REST API and the MCP server that these tokens unlock are next. The API is a Pro feature: tokens
work on any plan, calls on a survey need its workspace on Pro.
Answers from the Facebook and Instagram apps save again
Between 13 and 22 October, people who opened a survey from a link inside the Facebook or
Instagram app on an iPhone could not send their answers: every "Next" came back with a security
error. The same change made a few editor actions fail for creators — moving responses to the
trash, publishing public results, dismissing these cards. Both are fixed; nothing you saved was
lost, but answers those respondents tried to give in that window never reached you.
Why. Surveys embedded on other sites got cookies that work inside a frame,
and those cookies were sent to everyone. In-app browsers on iOS refuse them. Embedded surveys
now keep their session another way, and everyone else gets ordinary cookies.
A tap on the map can place the mark
Point questions have a new setting: A tap on the map places a mark. Turn it on, and respondents can tap the map to drop a mark straight away instead of pressing the question's button first. The mark opens the same pop-up and counts towards the same limits. The button still works.
The setting only works while the point question is the only map question on its page. If another one is on the page, the question's "tap to place" badge turns grey and taps do nothing.
Why. Respondents often click the map first and nothing happens. Point questions are the questions people skip most.
Coverage you can read, and a contrast control
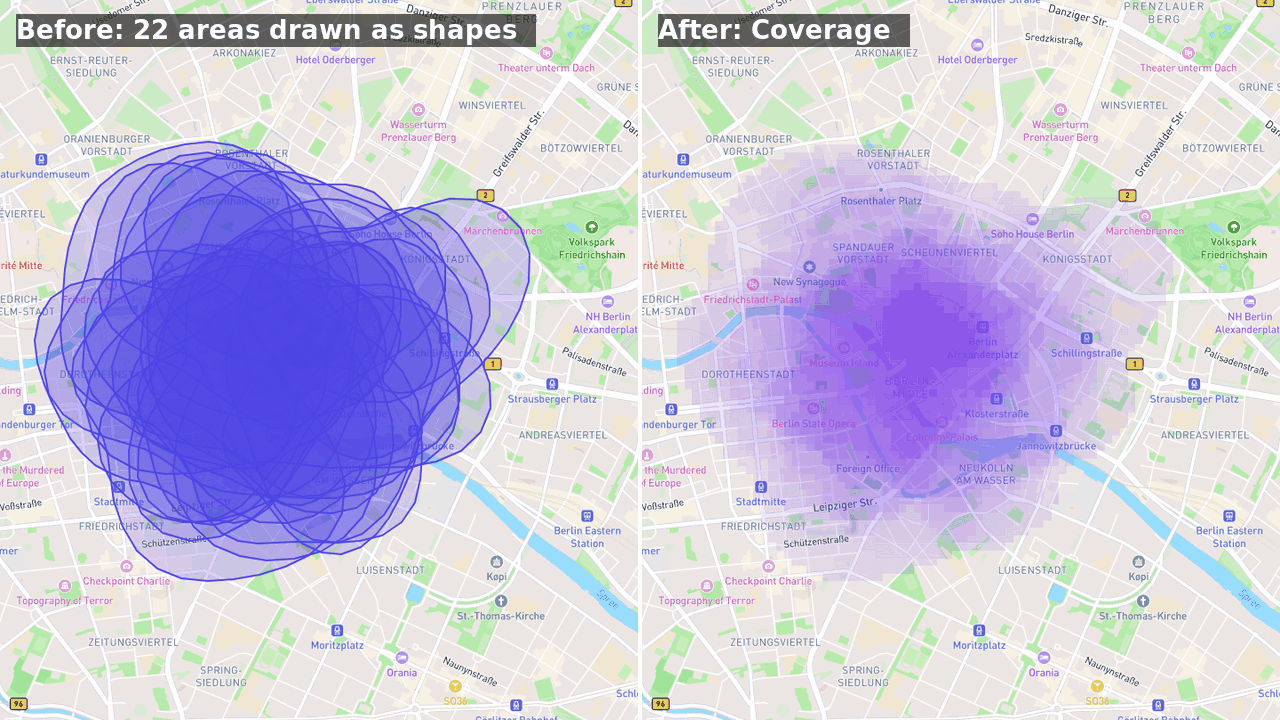
The Coverage surface on the Responses map now counts people, not shapes: someone who drew two overlapping areas counts once, and the row's "of N respondents" is the number of people.
The strongest spot on the map is now full colour, so agreement shows up even when nowhere near everyone drew the same place. In the coverage settings, Contrast decides how quickly the colour builds up and Min. people hides spots fewer people chose. A small chart under the sliders shows the result for every count.
Why. On real surveys the surface was so pale it was hard to see at all.
Question groups
Put several questions under one title and description, and show or hide them all with one
visibility rule. Click Add group next to New Question, or next to
Add Sub-question to group the questions of a map pop-up, then drag questions into it.
A group shows as a framed card, a plain heading, or a block that opens on tap.
Why. When twenty questions depended on one answer, the same rule had to be
set twenty times, and respondents saw one long list. A group sets it once — for example
"Your visit" appears in the pop-up only after the type of place is picked.
Show options as an icon grid
Single and multiple choice questions have a new Display as option:
Icon grid. Every option becomes a tile with an icon from the map icon set
above its label, in the question's colour or a colour of its own. Options that share a group
sit together under one heading. On a single
choice question, the grid folds to the chosen row once someone picks, and "Show all options"
opens it again.
Why. A list of fifteen kinds of place takes two screens to scroll in a
pop-up on a phone. As tiles, the whole list fits, and people find their option by its
picture.
A loading bar, and buttons that show they are working
Creator pages now show a thin bar at the top while the next page or a save is on its way, and a
button you pressed turns busy at once: a spinner, and no second send if you press it again.
Why. On a slow connection the Responses page can take a few seconds to arrive,
and nothing on screen said the click had registered. People clicked again, and some forms were sent
several times in a row.
Publishing changes keeps your conditional logic, form sections and button labels
Publishing Unpublished changes on a live survey no longer resets what you did
not touch: conditional questions and sections keep their Visibility rules, form
sections stay forms, custom button labels (and their translations) and
per-section hidden layers survive the publish.
Why. The working copy behind "Unpublished changes" was created with a list of
fields that predated these settings, so every publish quietly put them back to their defaults. If a
survey of yours lost its rules or labels on a publish, the previous version still has them: write
to us and we restore them, or restore the version yourself and publish it again.
Three ways to start a survey
+ New Survey now asks how you want to begin: start from scratch
(one click, straight into the editor, the map already on your city), the Wizard
(one sentence in, a full draft out), or — soon — connect your own AI agent through
MCP. Choose your usual way in Preferences (account menu) and the question never comes
back; "Start another way…" in the dashboard's ⋯ menu brings it back when you want it.
Why. The create page opened on Berlin for everyone and put the Wizard brief first,
whatever you had in mind. Now the map opens where you are when your browser allows it, or where
your workspace's last survey was — and the way you like to start is yours to keep.
Put your survey on your own site
Share now has an Embed on your site section: copy one line of code and the survey runs inside your page, on a city website, a project page or a client portal. Tilda, Webflow, Wix, Squarespace and WordPress all take it; in Notion you just paste the survey link. Responses land here as usual, and Responses → Traffic Sources shows which site they came from.
Forms grow with their content, so no inner scrollbars. For a map, set the height you want in the code. If you only want the survey on your own site, list its address under Sites allowed to embed; leave the list empty for Notion and other platforms that embed from a link.
Why. Creators kept asking to keep respondents on their own pages instead of sending them to a link, and it works everywhere now, including Safari on iPhone.
"After the last page" replaces "Redirect URL"
In Survey settings you now choose what respondents see when they finish: the thank-you page, or a web address you give, such as your project's Facebook page. The address has to be a full link starting with https://, and the field tells you if it is not.
Why. The old "Redirect URL" box accepted anything. A hashtag or a short message typed there kept respondents on the last page, pressing Finish again and again. Surveys that had such a value now show the thank-you page, and a link typed after a "#" works again.
Edit a live survey without starting over
Fixing wording, help text, translations or map settings, or adding an answer option, on a
published survey now saves straight to the live survey. There is no draft to create first and no
new version.
Adding, removing or reordering questions and sections still waits. Click any of those controls
and choose Start unpublished changes. Respondents keep the current survey while you
edit. When you are done, click Publish changes.
Why versions exist. Publishing structural changes creates a new version of the
survey, so every answer stays tied to the questions that respondent actually saw. Without versions,
deleting a question would delete the answers people already gave to it. Changing a question's type
or removing an option would leave one column holding answers to two different questions.
Responses shows every version together under All versions, and you can still
filter and export each version on its own.
Why this change. Many of you opened a published survey to fix a typo and found
every field locked. Now only the edits that could break answers you have already collected are
locked.
Coverage surface for drawn areas and routes
On the Responses map, a polygon or line question now has a Coverage action in its layer menu. It draws, for every spot on the map, how many respondents included it in their area or passed within a set distance of it on their route, so where people agree stands out instead of hiding under a stack of translucent shapes.
The row states the count ("≤ 7 of 12 respondents"); the settings let you change the cell size and, for routes, the corridor width. The surface follows the table selection like a heatmap does.
Why. "Draw the area you consider the centre" and "draw your route" are asked to find agreement, and the map could show it for points and spray but not for shapes.
New question type: Spray area
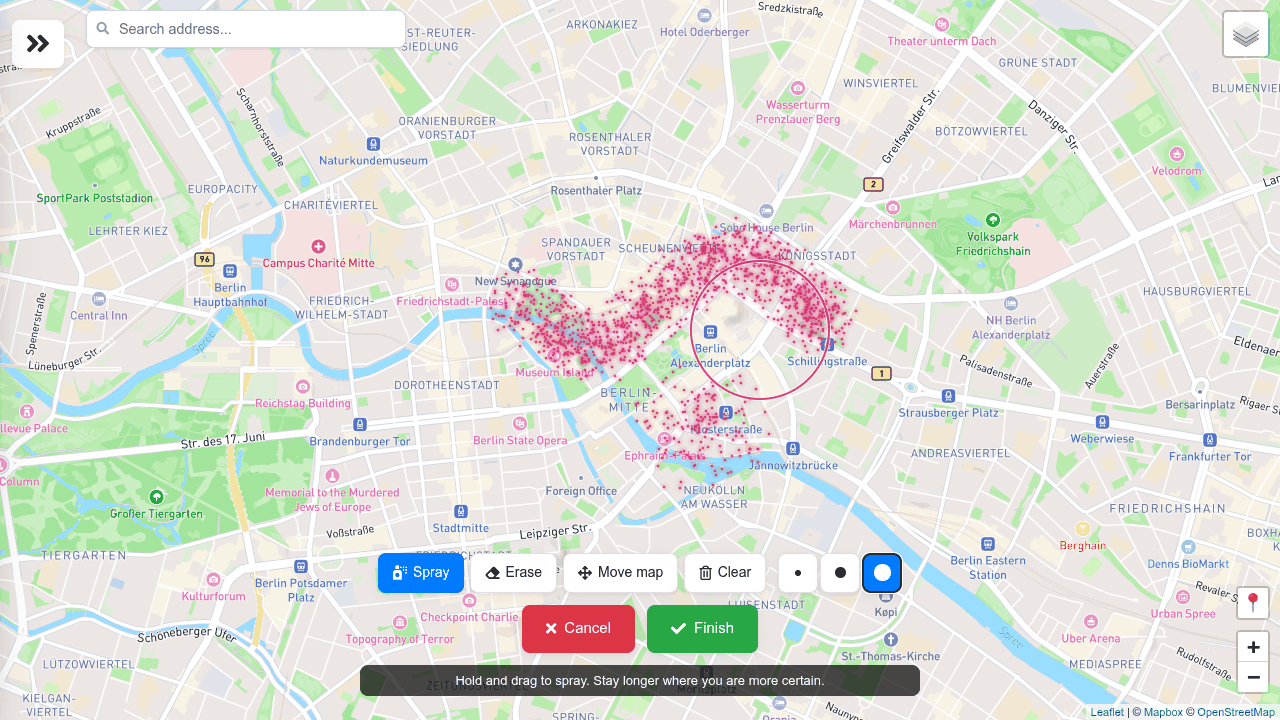
A respondent can now spray-paint an area instead of drawing a polygon. Pick
Spray area in the type picker and choose a default brush; the respondent paints with a
mouse or a finger, switches between three brush sizes, erases, and paints thicker where they are
more certain. It fits questions whose honest answer has no boundary — where does the centre end,
where do you feel unsafe, where is it too hot in summer.
Responses shows every cloud in the question's colour as a grid of agreement: darker cells are
where more respondents painted, each counted once however long they held the brush. The same grid
goes to the public results page, with cells below the anonymity threshold left out, and never a
single respondent's paint. Exports carry each cloud as a MultiPoint with its dot count and painted
area. Frozen public pages with a map block will ask you to re-freeze once.
Why. The method comes from PPGIS research (Map-Me, Huck et al. 2014): a
hard-edged polygon forces a precision people do not have, so they skip the question or draw too
much.
We no longer show empty sessions unless you need them
An empty session is someone who opened your survey and left without answering. Responses, the Overview and exports now leave them out. The headline still says how many there were, and Show brings them back.
Why. On widely shared surveys they outnumbered real responses two to one and hid how many people actually took part.
We will tell you here when something changes
From now on, a card like this one appears once in the editor after an update: what changed, and why. Older updates stay on the What's new page, under the gift icon in the top bar or in the account menu.
"Got it" or the × closes the card. "Don't show these" switches cards off; the page stays, and you can switch them back on there.